When it comes to tracking digital marketing in the outdoor hunting and shooting sports industry, it’s easy to get confused with what metrics matter most. A lot of times we think we are tracking the correct metrics or ‘key performance indicators’ for improvement—but get lost in the pretty charts and graphs of what are commonly referred to as ‘vanity metrics’ that can lead outdoor industry marketing managers astray.
 In this post, I want to give you a practical way on how to track, measure and report on your online efforts using a scorecard we use with our clients to prove the efficacy of our digital marketing efforts. The scorecard also helps us to understand where our strategy needs improvement and what to adjust over the course of our campaign(s).
So let’s dive in!
1. What is a KPI?
A key performance indicator (KPI) is a business metric used to evaluate factors that are crucial to the success of an organization. KPIs differ per organization; firearm businesses’ KPIs may be net revenue or a customer loyalty metric, while the government might consider unemployment rates, or non-profits, donations.
In digital marketing, there are three classes of KPIs we recommend you pay attention to.
A. Mechanical KPIs
Mechanical KPIs deal with the performance of your digital hub, or in other words—your website. Four critical KPIs to gauge are:
- Organic traffic – The number of strangers visiting your website of their own free will that found you on the first page of search engine pages vs. paid where you paid to be on the first page.
- Bounce rates – Bounce rate is one of the most misunderstood metrics. Bounce rate is the percentage of single-page visits (or web sessions). It is the number of visits in which a person leaves your website from the landing page without browsing any further. A good industry bounce rate to aim for is 20-30%. To decrease bounce rates, entice your users to click to a second page on your website.
- Website Grader – Your website must be fast and load under 3 seconds and meet these basic standards.
- Search engine optimization –Does your website meet the minimum criteria to be considered optimized?
A fast-loading, search engine (and don’t forget mobile) optimized website is the first step in ensuring a strong digital marketing foundation.
B. Website Conversion KPIs
Website conversion KPIs deal with how well your site is changing traffic into leads and nurturing them for customer conversion. Here is a list of conversion KPIs and how to improve them.
- Returning visitors – Add a blog and other fresh content to keep your prospects coming back.
- Visitor-to-lead conversion rate – Create problem-solving offers with landing pages and forms to convert visitors into leads.
- Lead-to-customer conversion rate – Does your shopping cart get above a 2% conversion rate?
- CLV– Customer lifetime value (CLV or often CLTV), is a prediction of the net profit attributed to the entire future relationship with a customer.
- CAC – Customer Acquisition Cost can be calculated by simply dividing all the costs spent on acquiring more customers (marketing expenses) by the number of customers acquired in the period the money was spent. For example, if a company spent $100 on marketing in a year and received 100 customers in the same year, their CAC is $1.00. (Source: Kissmetrics)
- Workflow conversion rates – Research from Gleanster suggests that, even when it comes to qualified leads, more than 50% of leads aren’t ready to buy on the day they first convert on your site. If you call up these leads and push them into making a decision right away, you will likely lose them. Workflows help by nurturing these leads through an automated workflow that are based on a series of actions taken by leads on your website with the goal of nurturing them to customers or warming the sale. Make sure to track these steps and optimize for each stage.
You can also conduct A/B testing on small tweaks to your website that can be tracked over time, so you know if your metrics are improving or declining.
C. Brand KPIs
In the digital space (websites, mobile, social media, text, blogs, forums, etc.), it’s much easier to track brand engagement and understand if your brand is taking hold in your customer’s minds. One way is to monitor customer interactions and comments on social media or through Google Alerts. Record how many positive and negative social signals (likes, shares, retweets, and mentions) are posted about your firearm, ammunition or hunting product and track over time.
A few relevant brand KPIs are:
- Direct traffic – Direct traffic comes from people who actively type in your brand’s name from memory, giving you a good indication of how well your prospects remember your products/services.
- Brand mentions – How many people out there are posting positive or negative comments about your brand or product?
- Network growth – Are your networks growing across your social media channels (Facebook, Instagram, Twitter, LinkedIn)?
- Blog subscribers – Are people finding your content interesting and signing up to receive more?
2. What KPIs don’t matter?
In the firearm and hunting industry, we are up to our eyeballs in statistics. From FFL registrations, background checks and the annual surveys released by the NSSF, these reports help us get our heads around how the industry is doing and how it relates to the health of our businesses. But there are some KPIs out there that just don’t matter.
Mentioned at the start of this post, vanity metrics are considered nice to have but don’t necessarily give us actionable data on making decisions about our marketing. Vanity metrics are things like registered users, time on site, pages/visits, downloads, and page views. They are easily manipulated and do not necessarily correlate to the numbers that matter: active users, engagement, the cost of getting new customers, and ultimately revenues and profits. (Source: Techcrunch )
I’ve talked to a lot of companies in the industry who consider Facebook and Instagram ‘Likes’ key metrics. But many struggle to tell me how many of those ‘Likes’ drive traffic, customers and sustained engagement.
Did you know that only 3% to 5% of your Facebook Page’s “fans” see the content you post? Regardless of how many people have clicked ‘Like’ once they’re on your brand’s page, the vast majority of them never return to the page itself and never see the content in their newsfeeds.
What to Measure Instead: % Feedback and Impressions
Use Facebook Insights, Facebook’s free analytics tool, to check which posts generate the highest level of engagement. The higher the level of engagement, the higher your EdgeRank score. (EdgeRank is kind of like SEO for Facebook newsfeeds) Think about the content and conversations that have the highest % feedback and impressions, and then come up with a plan for how you can replicate it. (Source: Hubspot)
3. You can’t measure what you don’t track.
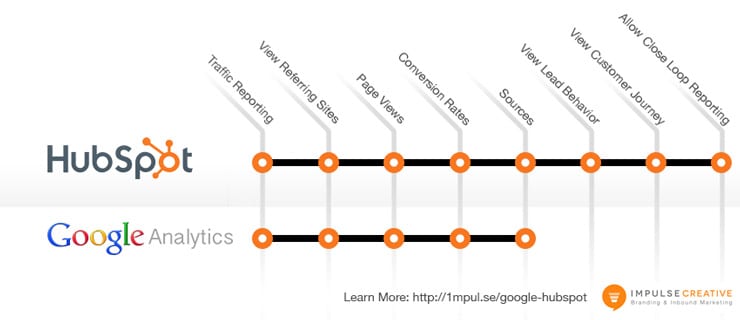
If you’ve ever tried losing weight, you know that every week you’ve got to stand on the scale to check your progress. Digital marketing is the same way. When it comes to tracking, there are a number of tools out there to use. We explicitly depend on Google Analytics and a paid software program called HubSpot.
When it comes to reporting, Google Analytics is way more powerful. It’s more flexible than HubSpot, and puts data in a granular, broken-down form. With Google, you can tell more about your online marketing and website mechanics as a whole, and you can slice the data in a million ways.
But, HubSpot shows you more about how individuals interact with your marketing and website. It lets you connect performance data to an individual lead, giving you insight into their specific journey, and helps you nurture them through the buying funnel. HubSpot is also better organized than Google, and will show you the need-to-know information about your marketing campaigns. (Source: Nectafy)
4. Track it with the scorecard.
 Now that you got a good download on what the right and wrong KPIs are, let’s turn these metrics into something you can use.
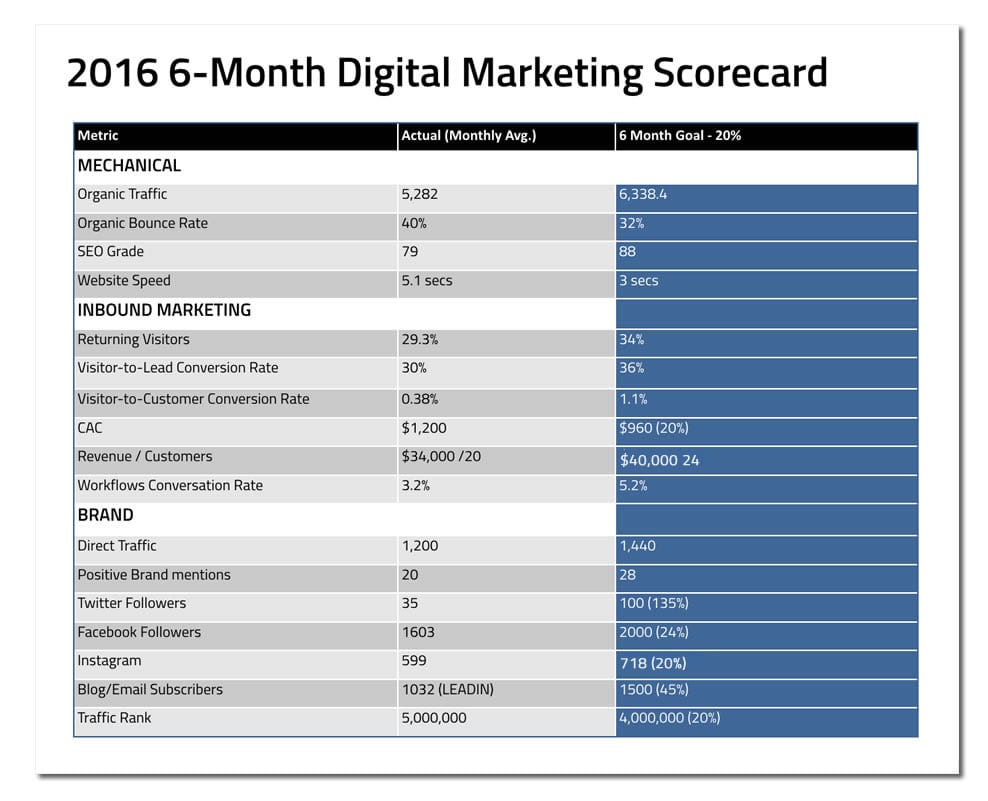
A good place to start is by setting a SMART goal across the board at 20%. 20% is enough to cause you to feel a little pressure and angst, but it’s not so high that it’s out of reach. Digital marketing takes time, and it’s important that at each stage you test your efforts to see if they’re working or not—in a logical way (we’ll be discussing what to test in a future blog post).
In our scorecard, we’ve listed out most of the metrics stated above in a table to track over 6-months. Make sure to collect data from your sales team every month to accurately report revenue. Pay specific attention to increases and pieces of content that help you make actionable decisions.
By scorecard tracking, you’ll be able to more accurately gauge the performance of your digital marketing efforts and turn strategy into targets.
As marketers, we track so many different data points to better understand what’s working and what’s not that it can become easy to lose sight of what’s most important. Reporting on your business impact doesn’t mean you should no longer pay attention to site traffic, social shares, and conversion rates. It simply means that when reporting your results to your executives, it’s crucial to convey your performance in a way that your C-suite can get excited about.
Rather than talking about per-post Facebook engagement and other “vanity” metrics, use the six metrics we detail in the below cheat sheet to report on how your marketing programs led to new customers, lowered customer acquisition costs, or higher customer lifetime values. When you can present marketing metrics that resonate with your decision-makers, you’ll be in a much better position to make the case for budgets and strategies that will benefit your marketing team now and in the future.


